


One of the reasons we launched the Quay Global Real Estate Fund nearly six years ago was that we believed the market exhibits material price inefficiencies across companies, geographies and asset classes. Most of this inefficiency comes from what we believe to be valuation mistakes undertaken by market participants, which leaves room for active managers to add considerable value over time.
In this issue of Investment Perspectives, we cast a skeptical eye over the valuation, operational and risk metrics embraced by the market, which we believe can lead to poor long-term investment returns.
Funds from Operations
For non-real estate investors, the standard earnings approach to valuation is price-to-earnings (P/E) ratios. The earnings are typically after depreciation and tax.
For local REITs, there is no depreciation allowance through the Income Statement (because assets are routinely re-valued). This is also true in many other regions around the world. The United States is the major exception, where cost accounting (i.e. including a depreciation charge) is the norm.
Earnings across most REITs therefore exclude one of the potentially largest expenses in real estate ownership – the cost to maintain the asset. In the US, despite a fully charged depreciation cost through the published accounts, market participants conventionally add back the depreciation to arrive at a ’Funds from Operations’ (FFO) metric. This metric is often used as a basis for valuation.
In our opinion, this often leads to potential mispricing of listed real estate securities. If the value of a security is based on the present value of its free cashflows, relying on FFO would mean that sectors with lower levels of depreciation – and hence lower levels of maintenance capex – would outperform sectors that had higher levels of depreciation over time. This is supported by historic data (see below), where sectors that have higher maintenance capex as a percentage of rent (Hotels, Industrial, Office) tend to generate lower total returns over time.
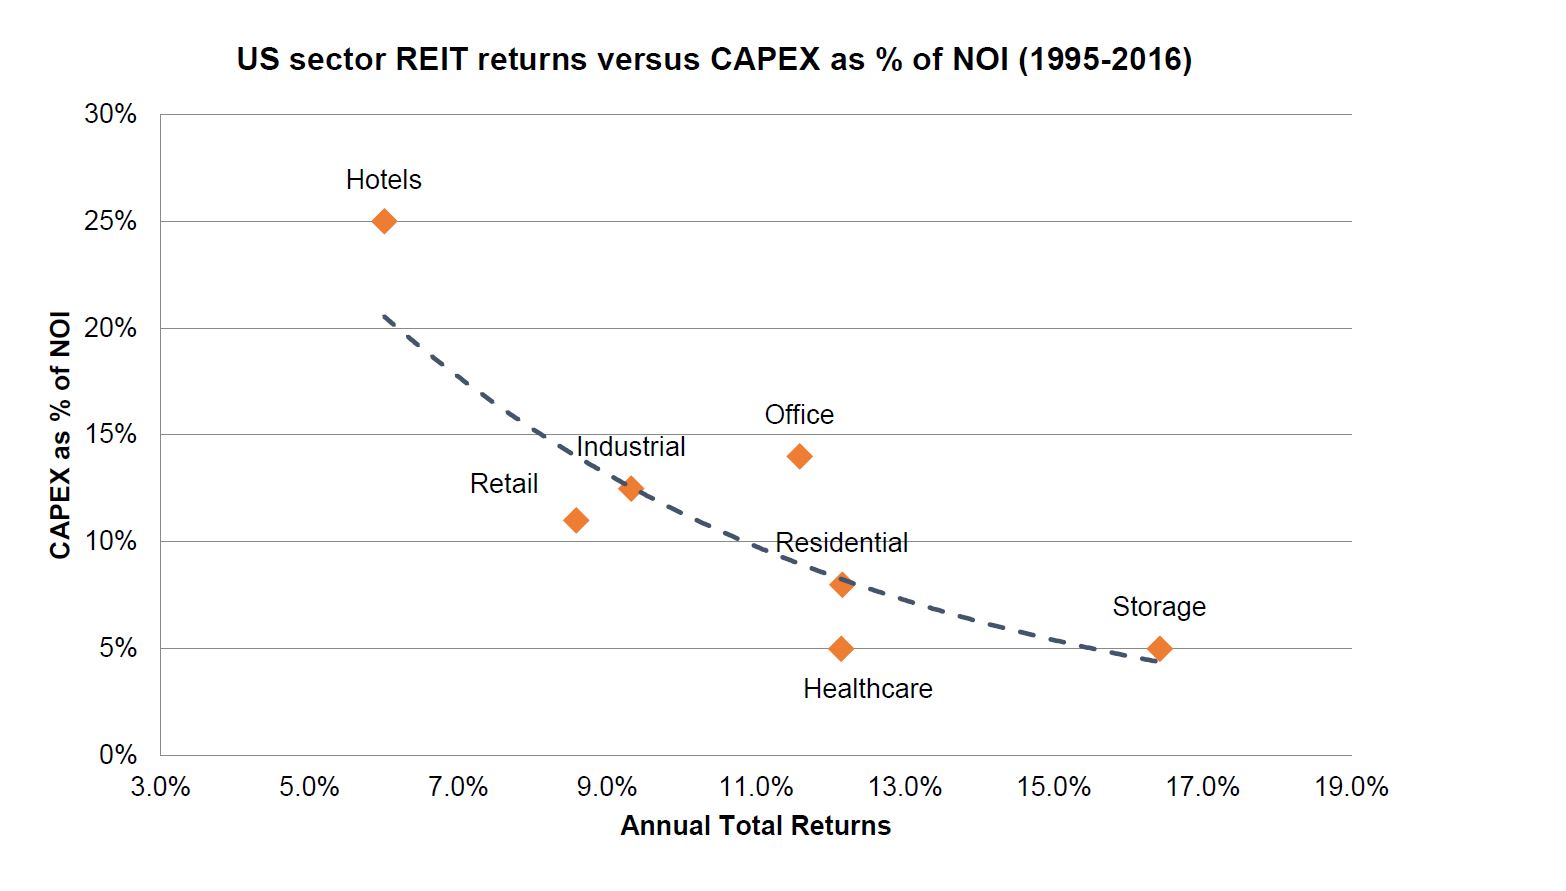
Source: Green Street Advisors, Quay Global, Bloomberg
This makes sense, since higher capex means lower free cashflow, which translates to lower (or less sustainable) distributions to investors and / or reinvestment opportunities. We believe the compounding impact of maintenance capex over a long period of time is generally under-estimated by the market.
Underlying operating earnings
This tends to be a company-defined metric, which takes a reported Net Profit and adds back company-defined non-cash items or one-off items. There is some merit to this approach where some costs truly are one-off or capital in nature, but as the cycle matures we find certain companies become more aggressive in their approach. Moreover, the company definition of earnings feeds through to consensus estimates so that investors are generally not always comparing like for like.
Over time, company-defined operating earnings and operating cashflows should converge. To test the validity of company-defined earnings, we often cross-check them with reported free cashflow.
By way of example, consider the following REITs – Cubesmart (CUBE US) and National Storage (NSR AU). We have always found the operational earnings of CUBE easy to understand and reconcile, while National Storage has generally been confusing and inconsistent. Both companies operate in the self-storage industry in their respective geographies and have similar rental and maintenance capex profiles. However, when we compare the last three financial years of company-defined operating earnings to the reported operating cashflow, significant discrepancies arise.
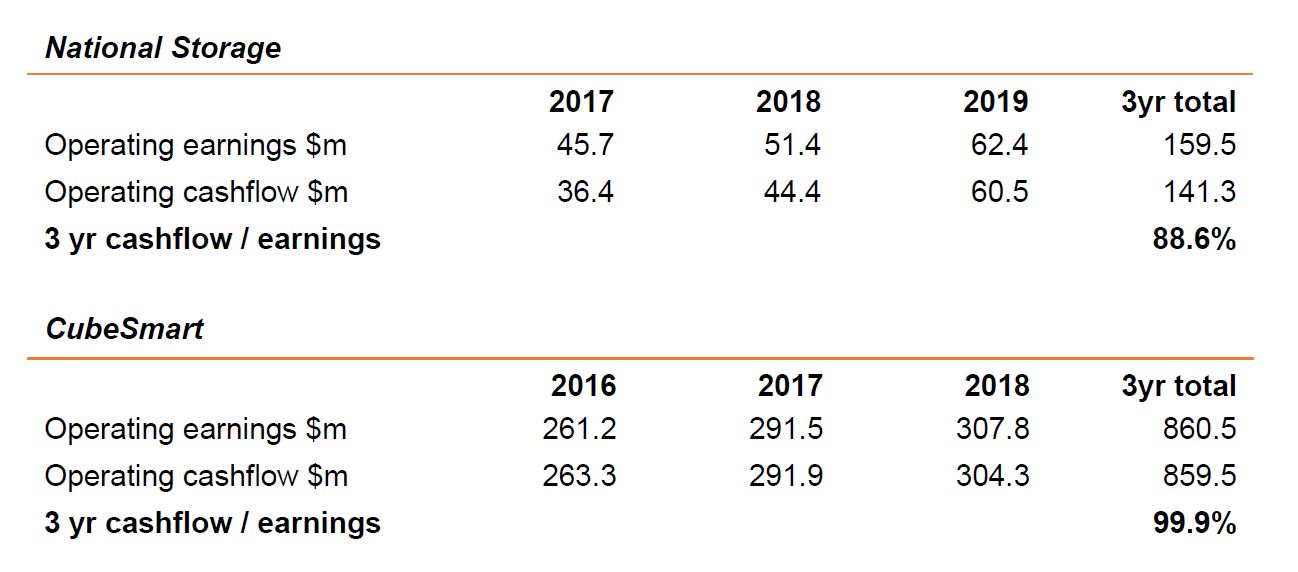
Source: Company disclosures, Quay Global Investors
CUBE’s operational earnings tie in with reported operational cashflow over three years, whereas NSR’s is out by 11.4%. Despite the discrepancies, based on company-defined earnings and current share price, the market is paying a 21.5x multiples for NSR, yet only an 18.0x multiple for Cubesmart.
Leasing spreads
A ‘leasing spread’, defined as the difference between the new rent and the prior expiring rent over the same space, is probably one of the most misrepresented statistics in real estate, especially in retail.
In our opinion it seems the market views leasing spreads as a representation of the health of a particular market or industry. Low or negative spreads represents a poor or weak market. Conversely, high spreads indicate a good or healthy market.
While this may be true, what it also reflects is the nature or structure of the previous lease.
Ignoring this later point often leads market participant to incorrect conclusions about the first point – that is, the health of the market. To highlight the potential issue regarding this metric, consider two landlords with two different lease structures. Landlord 1 offers tenants three-year leases with no rent increase during the term, but with a market review on expiry. Landlord 2 offers a six-year lease with 4% fixed annual reviews, and a market review on expiry.
Now assume Landlord 1 reports leasing spreads of +6%, while Landlord 2 reports leasing spreads of -5%. Which is the better financial outcome? The answer is that for Landlord 2.
The following chart illustrates the rental cashflows for each landlord over an eight-year time horizon.
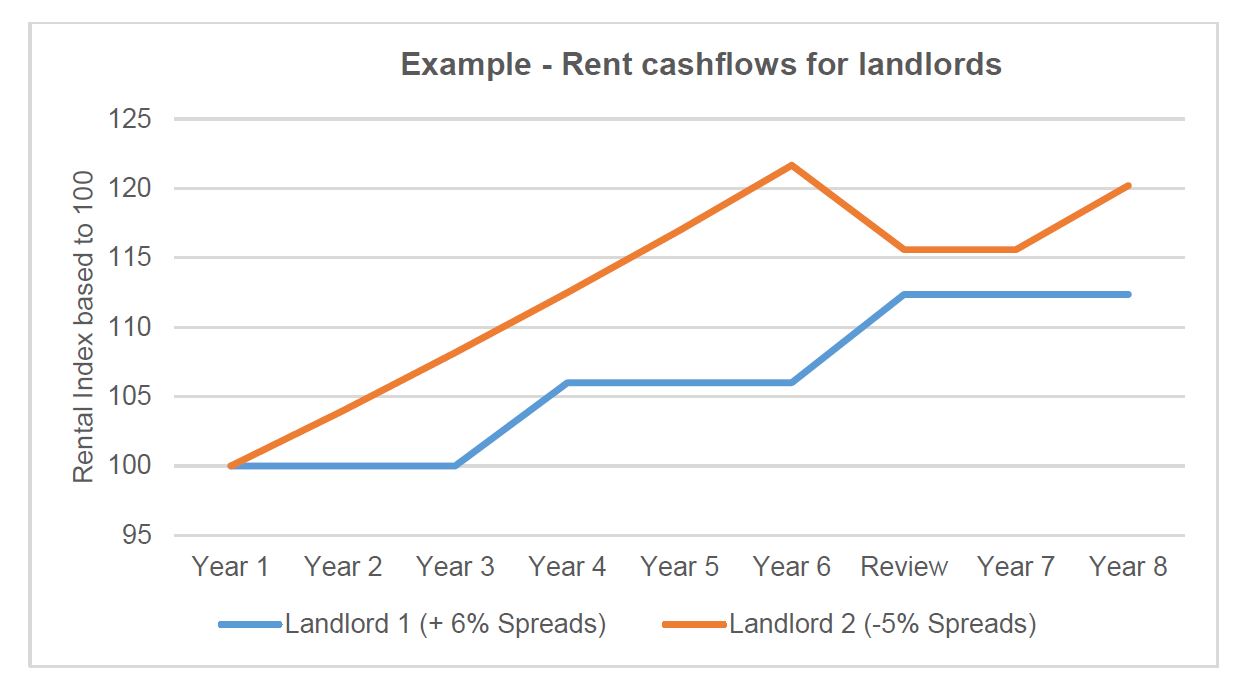
Source: Quay Global Investors
On a free cashflow basis, Landlord 2 is clearly delivering a better rental outcome for investors despite the negative leasing spread headline. All too often we see market participants react to negative leasing spreads without considering the underlying lease structures. Over time, we believe investors’ over-emphasis of this metric represents another market inefficiency.
Another consideration is what is (or what is not) included in the leasing spreads. Some company definitions exclude ’hold over’ leases in anticipation for development, while others include all leases, reducing the validity of this metric.
Same store rents or sales
Over time, analysts and investors have demanded companies report operating metrics on a ‘same store’ basis. This is designed to strip away acquisition, divestments and developments that may distort reported rents or sales, and therefore help analysts understand the operating performance of the underlying portfolio.
This can be a useful metric, all things being equal. However, all things are rarely equal. For example, Hong Kong-based Link REIT includes newly developed shopping centres as part of its same store rent growth, while Scentre Group in Australia does not.
Further, in some instances, same store sales growth is biased against the better operating companies. Again, we turn to an example to highlight the issue.
Consider two mall or shopping centre landlords, both redeveloping similar centres for the same amount of capital. In both instances the redevelopment is expected to increase retail sales from $100m to $150m per annum.
Now assume Landlord 1 does not fully lease the new development on time, and the tenant mix is not quite right. As a result, sales after development only reach $125m. The following year, the company ‘cuts’ a few leasing deals, increases occupancy and improves the tenant mix, and sales increase to $145m. Because the new mall sales are below the initial expectation it is likely the rents are not at a sustainable level, but we won’t know for sure until the leases expire in 3-5 years.
Landlord 2 fully leases the centre and gets the mix right. The year after development, sales hit $150m and grow in line with CPI thereafter.
Both companies report same store sales two years after development (24 months) to account for the benefits of the capital invested (Australian convention).
The following table highlights the sales path and reported same store sales.
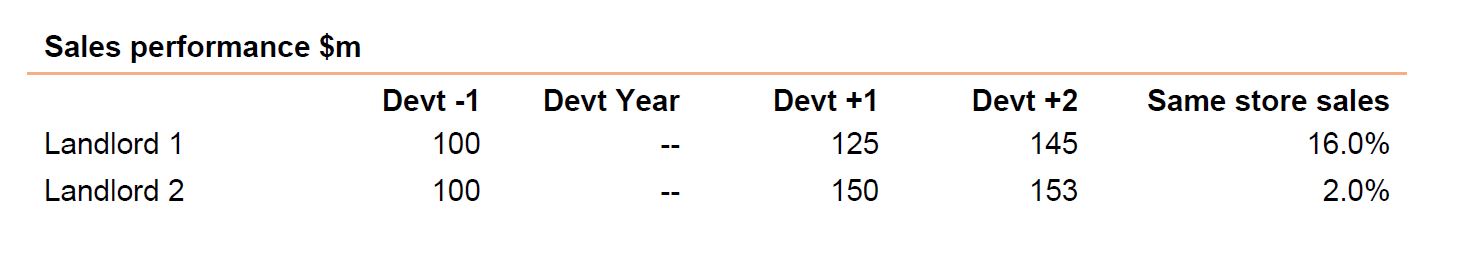
We often read research highlighting the ‘outperformance’ of certain REITs based on same store rents or sales. Without the wider context, these metrics are often misleading.
Assuming long-term leases (long WALE) represent low risk
A long weighted average lease expiry (WALE) represents the average term of the remaining lease across a property or portfolio. We believe investors tend to overpay for long WALE real estate companies, and underappreciate that long WALE generally represents higher, rather than lower risk.
One of the biggest problems with long-term leases is the inability for a landlord to extend the lease (like when times are good, for example) until the risk becomes significant.
For example, consider an office building with one major tenant and a lease expiry in 2030. In many cases, the tenant opts for a long-term lease for security of tenure and the knowledge that there is no need to think about their accommodation needs for an extended period. The longer tenure also appeals to the landlord and usually results in more generous incentives, and the resulting cash flows can be amortised over a longer time period.
However, uncertainty builds as each year passes and there is very little the landlord can do until two or three years from expiry. Further, eight years from now is a long time for many; real estate buildings can become redundant and businesses change. New, more appealing buildings begin to compete with space. All this means the landlord is usually required to spend heavily on capex to keep an asset competitive.
Importantly, there is no way a landlord can know or control at what point in the cycle that lease renewal negotiations will take place. At this point, the tenant (or their representative) understands the leverage they have during these negotiations, and if all this occurs in a weak market the outcome for the current landlord will likely be poor.
Conversely, we believe investors generally underappreciate the value of a building with many leases across many users staggered over a few years. Even if the WALE is shorter, a portfolio of many leases and tenants ensures no one lease expiry is potentially damaging, and therefore the power of negotiation rarely falls in favour of the tenant. Self-storage, student accommodation and apartments are great examples of low WALE, but in our view, very low risk.
Reliance on Net Asset Values as a measure of value
Net Asset Value (NAV) aims to represent the current market value of the underlying real estate within a REIT less liabilities, usually on a per share basis. This is then compared to the market current price, and a buy / sell signal is generated depending on the relativities.
NAV calculations are usually based on independent valuations or comparisons to recent transactional evidence.
We first published an article in 2015 comparing NAV investing to total return investing. As per our summary in that article, we caution against this approach to investing because:
- NAV investing implicitly relies on the assumptions and return objectives of third-party investors or assessors
- NAV calculations are often ‘backward looking’ (if based on transaction) and therefore potentially encourage pro-cyclical investment decisions
- Investing in listed real estate based on NAV can miss crucial elements of total return, and
- Poor pay-out ratios, balance sheets or a limited investment opportunity set may result in companies trading in line with NAVs over time, but still generating unacceptable total returns.
Nowhere has NAV investing been more destructive than in the mall REIT space, where there has been a significant lag between listed REIT pricing and direct mall transactional evidence.
How does this affect Quay?
We launched the Quay Global Real Estate Fund in 2014 because:
- As far as we could determine there weren’t any high conviction, concentrated investment choices from listed global real estate investment managers, and
- We believed the listed real estate market is fundamentally inefficient in pricing.
The market inefficiency stems from what we believe to be fundamental misperceptions in valuation and risk common in the wider market. This includes underappreciating the cost of ownership, reliance on company-defined earnings, misunderstanding same-store metrics and overvaluing long-term leases.
In some instances, these inefficiencies can take many years to play out, but that doesn’t faze us; we consider ourselves patient investors.
Download the full article here.