


Driving this has been almost 10 years of unbroken economic growth in the US. While no one knows when growth will slow, the Federal Reserve is intent, through successive rate rises, on ensuring that the economy does not overheat. At some stage tighter monetary conditions will bite, and the economic indicators will start pointing towards a slower rate of growth.
How would the market react to a change of outlook? Could it be the catalyst for equity markets to take pause, and what would be the implication for global real estate?
It’s often said that real asset classes (such as global real estate) offer attractive attributes later in economic cycles, and particularly when the yield curve is flattening or inverts. This paper will look at the validity of this theory.
What goes around comes around
Much has been said about the yield curve as a predictor of economic slowdowns in the US. In March this year, the Federal Reserve Board of San Francisco (FRBSF) published a paper titled Economic Forecasts with the Yield Curve. They conclude that the yield curve or term spread, being the difference between long-term (10-year) and short-term (2-year) interest rates, is a strikingly accurate predictor of future economic activity. In fact, every US recession in the past 60 years was predicted by a negative term spread – that is, an inverted yield curve. Furthermore, they also note that a negative term spread was always followed by an economic slowdown and, except once, a recession.
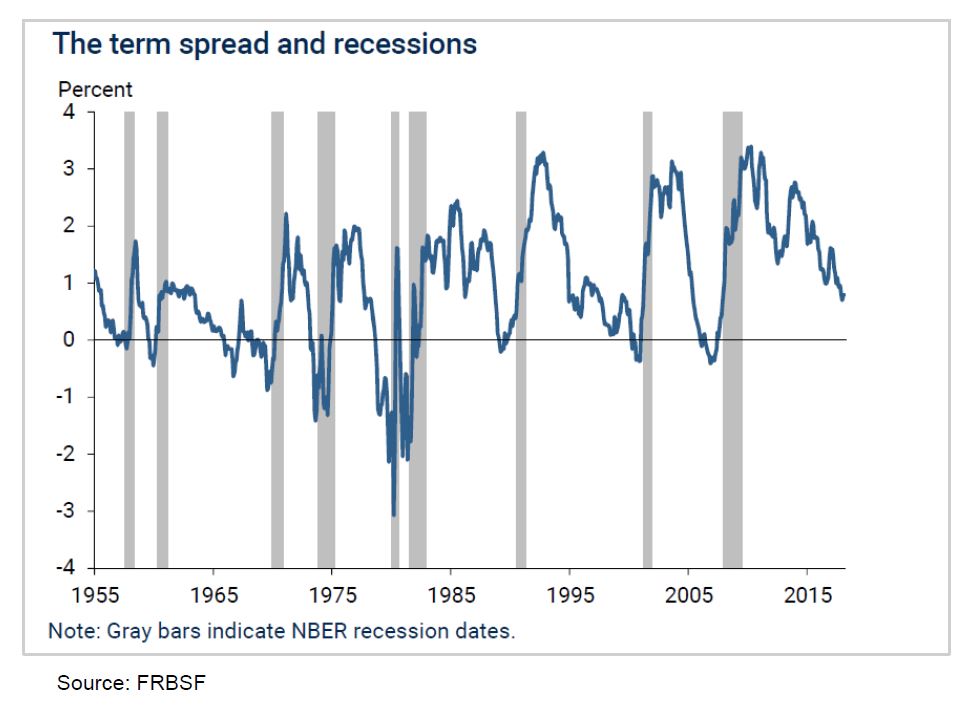
Interestingly, the FRBSF also noted that the delay between the yield curve turning negative and the beginning of a recession has ranged between six and 24 months; and while historical circumstances differed across these episodes, the patterns of past yield-curve inversions were remarkably similar: The decline in the term spread was generally driven by a pronounced increase in the short-term interest rates. Long-term rates, on the other hand, typically moved much more gradually and either increased slightly over those periods or declined.
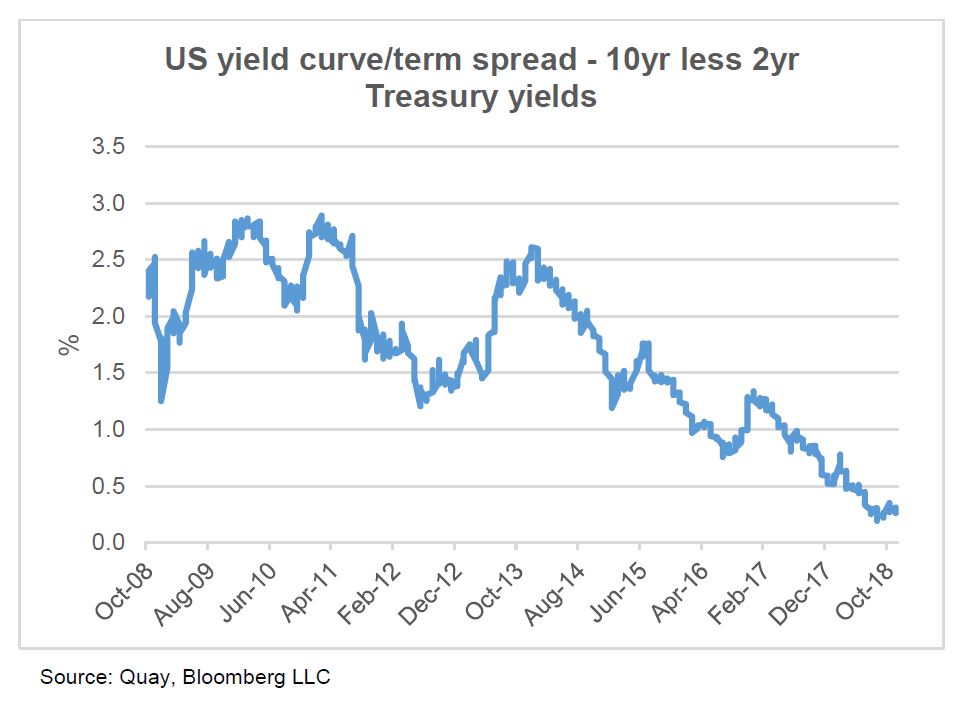
In September this year the Federal Reserve raised its Fed Funds rate for the eighth time since late 2015 and signalled three more hikes into 2019. Over those three years the Fed Funds rate has increased 200bps, while the US 10-year treasury yield sits only 85bps higher. As we sit here today, the term spread is now at less than 30bps and is hovering at the lows for this cycle as short-term interest rates continue to rise faster than the 10-year treasury yield. Sound familiar?
How vulnerable are markets to US economic health?
Global equities (as represented by the MSCI World Index) has a 62% weighting to the US that, over the past five years, has contributed 34% of the 39% total return enjoyed in USD terms. In other words, approximately 62% of the index has contributed 87% of the return. While it’s true that not all revenues are earned in the US (estimated at ~70%), US GDP represents 24% of world GDP and the US is the largest trading partner with the EU, China, Japan and Canada among others.
It therefore stands to reason that if the US economy happens to hit a speed bump, the risks to the outlook for aggregate equity market earnings and therefore returns would likely be to the downside.
How equities and real estate perform
For this analysis we observed the five most recent prior economic downturns in the US as defined by the National Bureau of Economic Research (NBER):
- January 1980 – July 1980
- July 1981 – November 1982
- July 1990 – March 1991
- March 2001 – November 2001
- December 2007 – June 2009
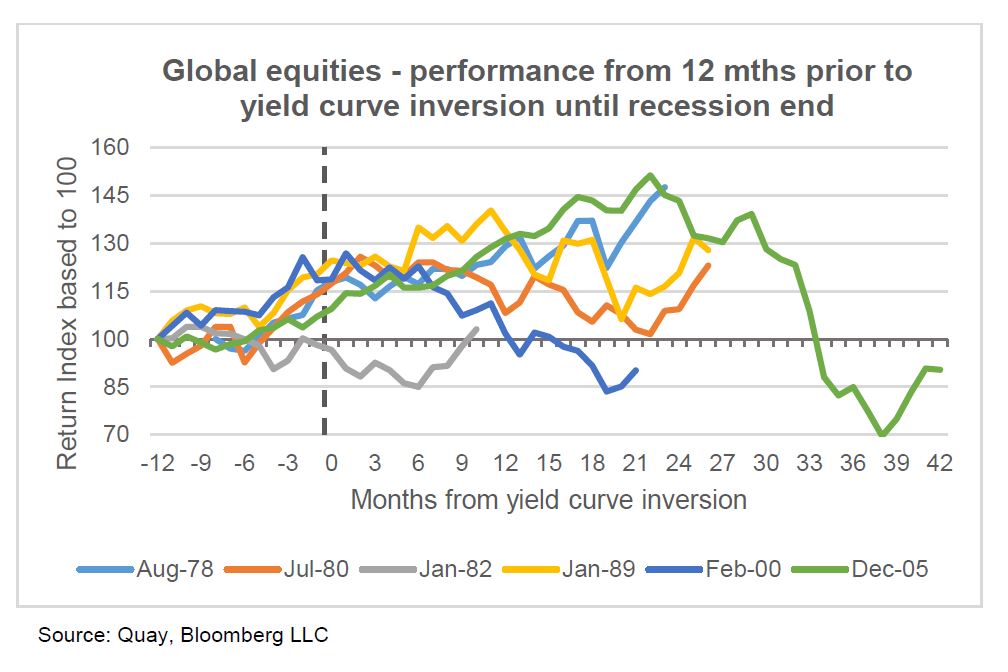
For each period we analysed the performance of global equities and global real estate relative to each other, starting from 12 months prior to the yield curve inverting through to the end of the following economic downturn. (We chose 12 months as an arbitrary number and it is not meant to be a forecast.) As global real estate data isn’t available prior to December 1989, we used the Wilshire US REIT Total Return Index as a proxy for the periods prior. We believe this is justified, owing to the over-represented weight of US REITs in the global index (~54%) and the long-term 99% correlation.
This analysis shows that in the lead up to the yield curve inverting – and even after – global equities has historically performed well. However, at some point, reality bites and returns (in all but the period covering 1978) were given back. The magnitude and duration of the declines varied around the severity and reasons behind each of the downturns.
The same analysis of global real estate showed that in all observations, total returns were positive in the lead up to the yield curve inverting – and continued to be so in the following 12-18 months.
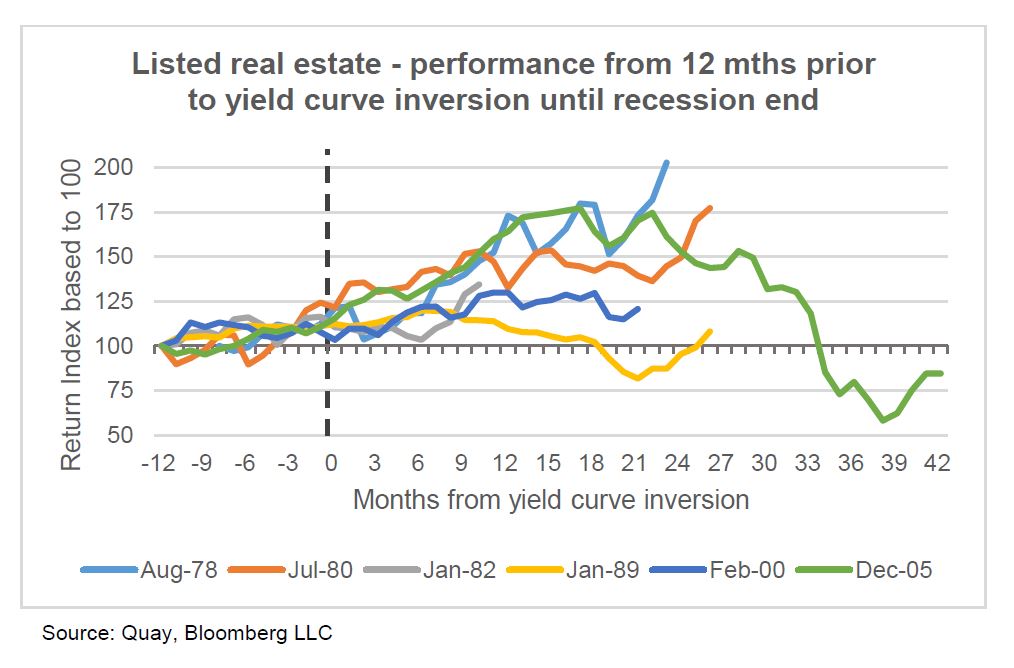
Relative performance in the period before the yield curve inverted was mixed, with global real estate underperforming global equities in the periods 1989 and 2000, but out-performing in the other periods. However, once the curve did invert, global real estate outperformed global equities over the subsequent 12 months or longer in all but one observation – the recession of 1990/91.
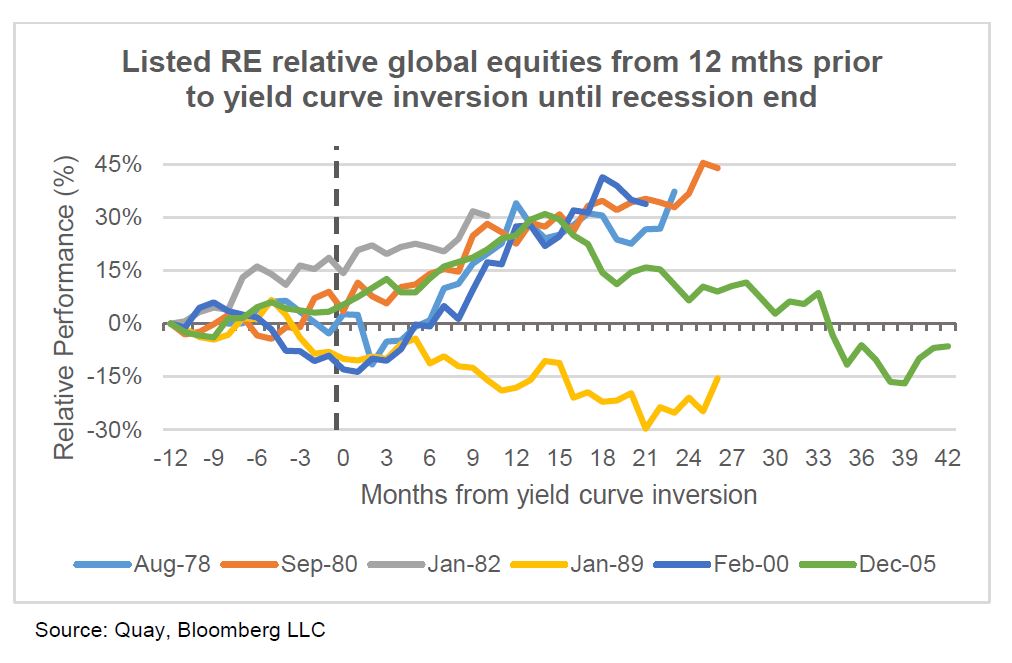
We believe the poor relative performance of listed real estate for this period can be explained by the circumstances. In 1989 inflation in the US was rising, and the response from the Federal Reserve was to raise short-term interest rates to 9.75%. This came at the same time as a period of elevated supply in commercial real estate markets. It was a similar story in the UK, Australia and many other developed economies. As a result, commercial real estate markets were hit hard by a combination of waning economic activity and delivery of new supply.
More recently, during 2005/06 in the lead up to the GFC, global real estate outperformed global equities both before and well and truly after the yield curve had inverted. It was not until February 2007 that the relative performance started to unwind. During the 15 months before February 2007, the date the yield curve inverted, global real estate outperformed global equities by +29%. If we include the 12-month period prior, the relative performance was +41%.
So, what does this mean?
The reason global real estate has in the past outperformed global equities during the period preceding and during an economic slowdown is because of the relative defensiveness of the earnings. Revenue is derived from rent, which is often subject to contractual leases of varying terms with fixed or inflation linked growth. Revenue will therefore generally be more reliable and less cyclical.
What’s more, real estate entities, as they are not manufacturing widgets or providing consumer services and employ less people, will generally have much higher operating or EBITDA margins. The right real estate – well located and servicing industry segments backed by long-term positive secular trends – will always be sought, regardless of the economic conditions. And, provided the real estate sits inside entities with sustainable capital structures and disciplined management, in our opinion the risk of permanent capital loss is low.
While the circumstances of prior slowdowns were different, we can observe that, apart from 1989/91, global real estate provided better returns than global equities in the lead up to the yield curve inverting and for a significant period after. Today, unlike 1989/91, outside of a few select markets and sectors, there is no evidence of a global surge in new real estate supply.
Moreover, today’s listed real estate balance sheets are on average more conservatively geared (certainly relative to pre-GFC), earnings payout ratios are lower, and business strategies more risk averse. We believe all this should bode well for the relative defensive characteristics of global real estate.
No-one knows the timing of the next economic downturn, although some commentators are now pointing to the roll off in US government fiscal stimulus as a potential catalyst and the year 2020 seems to be getting some attention in popular media. Only time will tell if this is right – but at some point, this economic cycle will run out of steam. It might therefore make sense for those with equity allocations to start thinking about the benefits of including global real estate as part of that allocation.
Download the full article here.